Charts. To many of us, they seem complex and difficult. Like a secret language or a code, you have to crack. A scientific formula, even. But they can actually make your knitting life easier and aren’t as scary as you may think. They can help you to learn how to read your knitting and can make it easier to memorize a pattern. Charts can make knitting instructions shorter and may even help preventing (or spotting) errors in a stitch pattern. They are a tool for us to use – or not if we so choose. But to make the decision whether charts would help us in our situation or not we should first understand them.
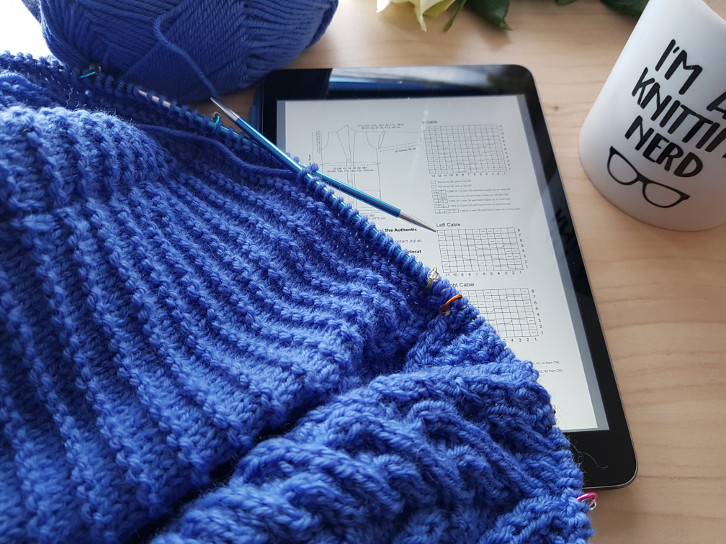
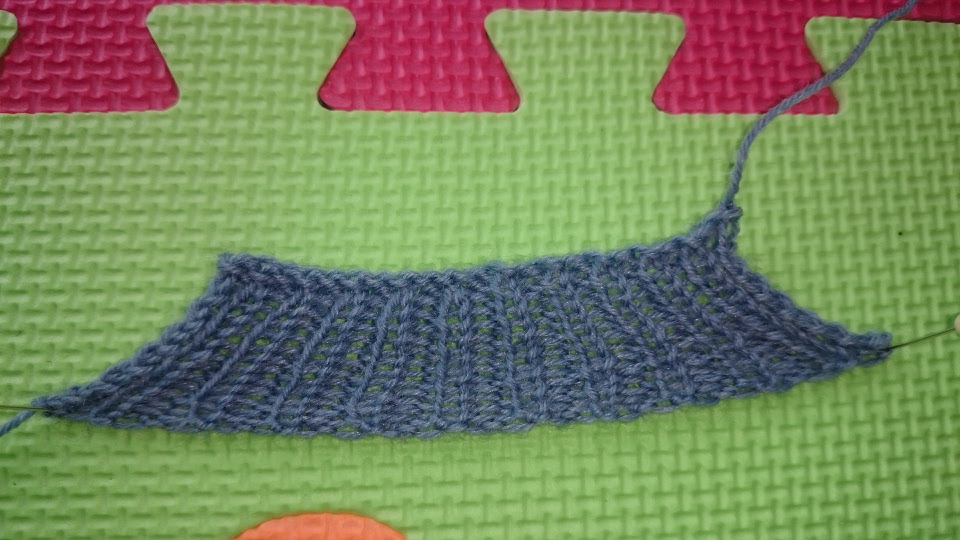
My current project: Joji Locatelli’s Citadel
What Are Charts?
I’ll get a little theoretic here, but don’t worry there is an extensive practical part following this. If you want to jump straight into the practical part read on at “How to Read a Chart”. This is mainly my attempt to explain what the original intentions behind charts probably were.
A chart is basically a simple written language in tabular form using an alphabet of symbols. It is a system of giving instructions on how to knit a stitch pattern in a concise way that is easy to keep track of. The charts themselves don’t need to be translated at all (only the key) which makes them a great tool for patterns that you want to be available in multiple languages. Unfortunately, the symbols are not standardized and might change from designer to designer. But since they are based on images it is often still easy to understand what you are supposed to do even if you have no key or legend present.
The key will give you an acronym or abbreviation of the knitting stitch you need to knit any time this symbol is being used in the chart. It is easy to find out what those abbreviations mean (the internet is full of knitting knowledge) but most patterns come with a glossary giving you long-form instructions for those as well.
So much about the theory.
How to Read a Chart
You always start reading a chart at the bottom most line. The first charted row will usually be a right side (if not the pattern will tell you so). That means you will start at the bottom right corner of the first row shown in the chart. Each row of the chart has a number of small boxes and each of these boxes stands for one stitch or instruction you need to knit. In these boxes, you will either find a symbol or it will be left blank (white). A blank box most commonly stands for a knit stitch.
Working Stitches
As I’ve said before you will likely see a key or legend alongside your chart(s). This will tell you what each symbol means. Here are a few common symbols:
⎼ or ● purl
╱ right-leaning decrease or k2tog
╲ left-leaning decrease or ssk
○ yarn over
You will notice that if you decrease, you are working two (or more) stitches. Similarly, some increases make you turn one stitch into two or more, or create an entirely new stitch. This is why I prefer to think of these boxes as instructions or commands (like a programming language) rather than stitches.
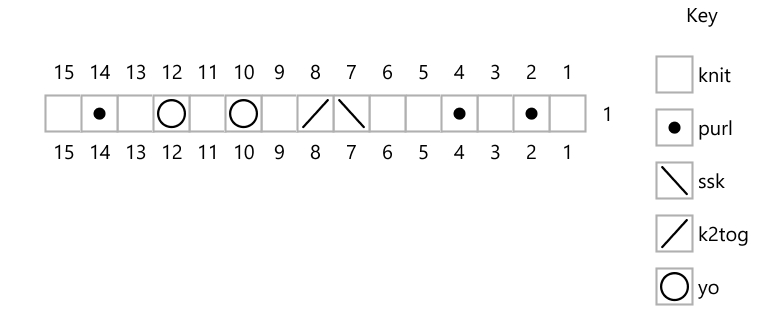
Take this chart for example. We start at the right corner. The numbers underneath the boxes tell you which stitch or instruction of the row you are at. So first, we knit one, purl one, knit one and purl one, then we knit two and now we have a decrease (ssk). And following this is another decrease (k2tog). So we just worked four stitches and ended with two but only needed two symbols. Then we knit one again and have a yarn over, which creates a new stitch but we still get a symbol for it. We repeat that and end with knit one, purl one and knit one. These are the written instructions for this chart: (K, p) x 2, k2, ssk, k2tog, (k, yo) x 2, k, p, k.
Working with a Chart
If the pattern (or chart) doesn’t state otherwise, you will repeat the current row of the chart over all of your stitches. For the sample above that would mean, after working these 15 stitches we would start at stitch one at the right corner again.
If the pattern tells you to work a chart until the piece measures a certain number of inches or to repeat it a number of times more, it means you start at the beginning of the chart again. That usually means row 1, column (or stitch) 1. (There are exceptions to this but the pattern will tell you.)
Sometimes a chart will only show you uneven row numbers. This means that on the even row numbers you will knit all stitches as they appear. If you are uncertain what that means, look at the written instructions. But usually, you will simply knit all stitches except for purls.
In the Round
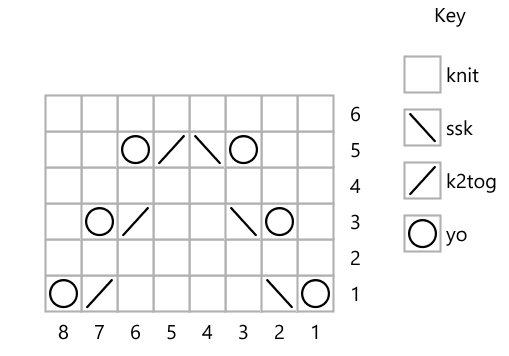
Simple lace chart
Reading charts in the round is a bit simpler, so we’ll tackle that one first. You work each row of the chart from the bottom up, right to left. So if you start a new row of your chart, go up one row and start at the first stitch or column again.
Flat Knitting
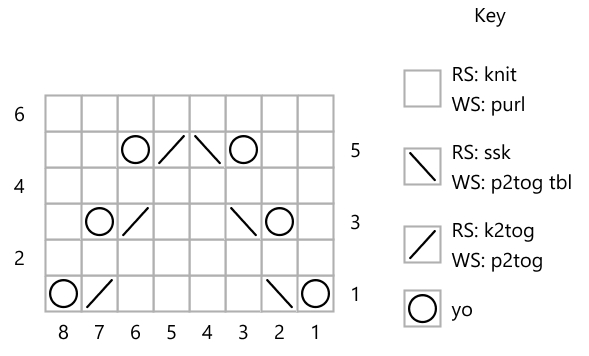
Again the simple lace chart but specifically for flat knitting. The rows numbers show you which side to read the row from and the key tells you how to knit these stitches on both the right side (RS) and the wrong side (WS). but be careful, not all charts for a flat knit piece do this, some look just like in the round charts but are still read the same way as this chart.
This is probably what many people find difficult: The chart only shows the pattern from the right side. But if we are knitting a flat piece, we will have to work wrong side rows as well. So what do we do? First, wrong side rows are most commonly read left to right because that is the direction we are knitting in if we look at it from the right side of the work. Second, we knit wrong side counterpart of the stitch shown in the chart. A knit stitch looks like purl stitch on the other side, so we knit that. A purl stitch looks like a knit on the wrong side.
Mostly it won’t get much more complicated than this but there are some charts that include patterned wrong side rows. Often the legend will then include the correct wrong side instruction for the stitch shown, if not you can look at the written instructions or the glossary. The pattern usually tells you what to do somewhere. For example, a k2tog will most commonly be worked as a p2tog and an ssk as an ssp.
If the wrong side rows are not shown in the chart than what I’ve said above comes into effect: we work the stitches as they appear.
Advanced Chart Reading
Now that we have the basics down let’s look at some specialized charts and specific cases, you will likely sooner or later come across.
Lace Charts
Lace charts can be easy (see the sample chart above) or very complex. Especially if we want to knit an intricate lace shawl you may have to keep track of multiple charts at once or have to transition from one chart into the next as the shawl gets larger. Now, this may seem daunting but if you carefully read the instructions and prepare the pattern ahead of time you should be fine. Make sure, you understand which stitches are worked with which chart, keep track of your place in them and your current allover row and use a lot of stitch markers.
I usually mark off each section of a shawl (the wings and the center for example) with one type of stitch marker and use another distinct type between each chart repeat within a section. That makes it easy to spot possible mistakes as you are only ever looking a small number of stitches at once.
Cable Charts
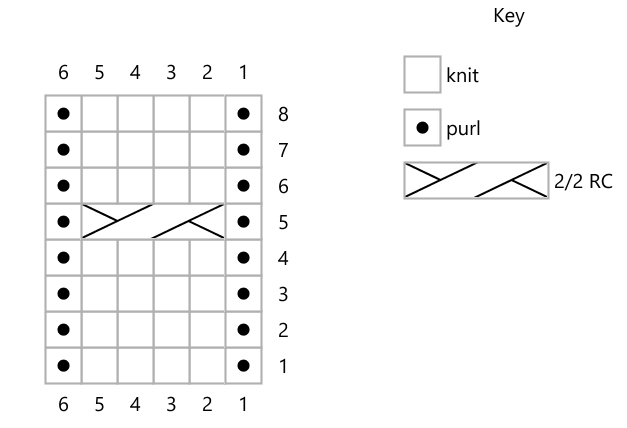
A chart for a simple corded cable pattern. Cable charts use special symbols stretching over multiple boxes, to show which stitches will trade their places.
With cable charts it’s similar to lace charts, they can be simple or very complex. And for larger projects (like the Citadel cardigan by Joji Locatelli I’m working on right now), there are usually multiple charts to keep track of.
What differs is that we get special stitch symbols that stretch over multiple stitch boxes. These tell you how many stitches you are supposed to cross and how to cross them. It may be a bit daunting at first, but it makes things easier. Especially with cable stitch motifs, the charts will closely resemble the knit motif. So you can see early on how it’s supposed to look and where you may have crossed a few stitches the wrong way.
Color Knitting Charts
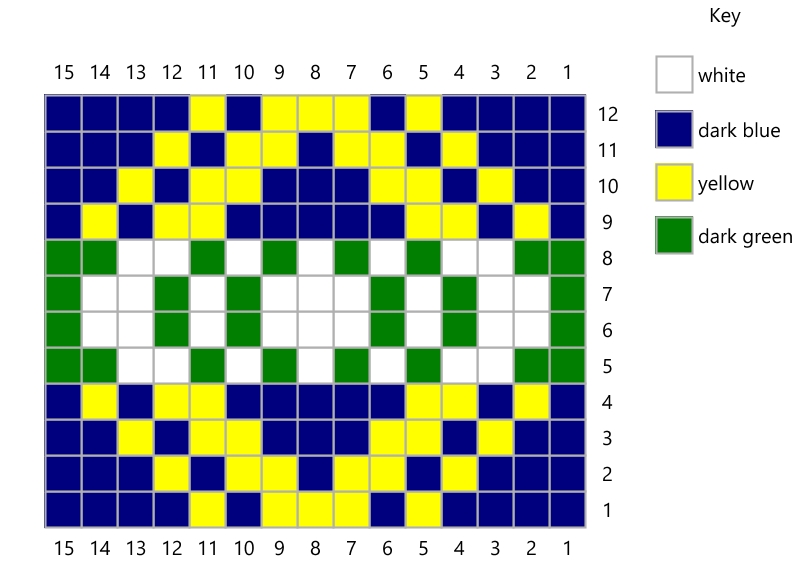
A colorwork chart
Charts for knitting with multiple colors – whether it’s fair isle, double knitting, intarsia or mosaic (or any other way you can think of) – usually come in one of two ways.
Back in the day when no one had a color printer at home, they were most commonly in black and white, with different symbols representing the different colors. The instructions would usually tell you which color to use for which symbol.
Today they are mostly in color and much easier to read and follow, I believe. Each box is colored in with the color we are supposed to knit this stitch with. If you are not using the original colors (I don’t know about you but I’ve never knit anything in the original colors), you will have to make a key of your own telling you which color on the chart represents which color you are using. Or you can make your own chart using your colors. The added benefit is that you may already get an idea of whether the colors work together or not.
The No Stitch Symbol
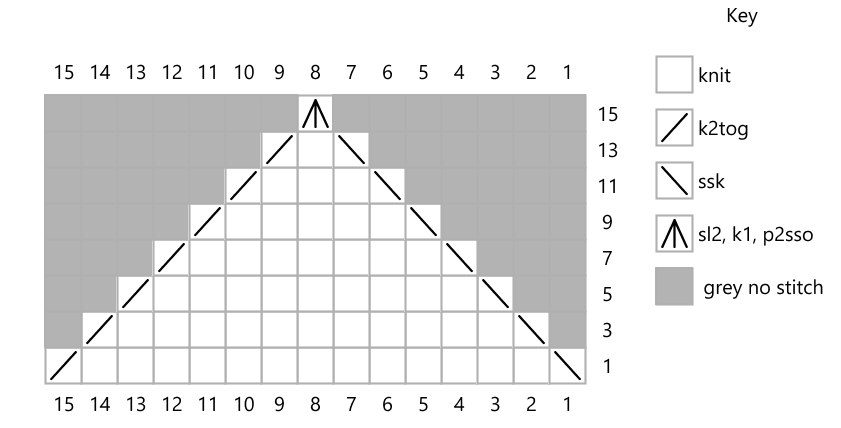
Just ignore the grey boxes here. Those stitches have been decreased and don’t exist anymore.
This one throws many people off. There is a stitch symbol representing no stitch. You use this in charts when one row has fewer stitches than the one before it since classic charts are always rectangles. I’ve seen this most commonly used in lace charts (especially shawls) and in fair isle cardigans (sleeve shaping or yokes, for example). Any time a pattern is most easily explained using a chart but you are not knitting a rectangle and the chart rows will get shorter (or larger).
Most commonly the no stitch symbol is a grey box. But you may come across different ones but again your pattern will tell you what the stitch means.
Repeats

The red box shows you which stitches to repeat all over.
Charts are usually repeated multiple times across stitches. It would not be easy to keep track of a chart with 60+ stitches and hundreds of rows. That’s why the chart will only show as much as needed. If the stitch pattern has a 10 stitch and 12 rows repeat, it will usually be 10 columns wide and 12 rows high. Whenever you finish those 10 stitches you start at stitch one again, same goes for the rows.
Some charts will have a frame around a number of stitches and rows, however. Some stitches will (and possibly rows) will be left outside. You will only repeat the stitches and rows within the frame across all of your stitches then. This means that if your repeat the chart you may not start at row one and for a row repeat you may not start at the first stitch. And you may not end at the last stitch or row either for each repeat. The ones outside of the frame will only be worked once. These stitches are usually edge stitches or set up rows, which I will explain next.
Set Up Rows and Edge Stitches
If the stitches left outside of the frame mentioned above, are at the beginning of the row in the chart, you will knit them at the beginning of each row or round. You may also find some at the end of a row, these you will knit at the end of each row or round.
This is used for multiple reasons. On the one hand, you may have a chart with motifs staggered across it. That usually means you have half motifs at the edges of the repeat. For a nice clean edge of the motif, there may then be a couple of edge stitches that complete these motifs. On the other hand, you may have a different pattern on the edges of your work, because this is where the button band will be, or you want a nice flat edge (on a blanket for example) or try to achieve symmetry across your piece (both edges should look the same). You also see this a lot on fair isle sweaters even though they are usually knit in the round. That’s usually where the steek will be placed.
Now if you have entire rows left outside of the repeat, these are usually set up rows. (You may also come across them at the end of a chart, but I don’t know if they have a different name then, to be honest.) You work these rows once, to set up the pattern or fade it out. So either directly before you start the chart or directly after you finished the last repeat of the chart repeat. You also often see this for cable motifs to add stitches or decrease them again afterward (since cables draw the fabric in).
Set up rows aren’t always included in the charts, some pattern may only mention them in the instructions. And some patterns may keep set up rows and edge stitches in separate charts even.
How Charts Can Help You
Charts are a visual tool. The chart often already makes the motifs you are going to knit visible, so you know how it’s supposed to look and can catch your errors quickly. And because they are such an adequate visual representation of what you are knitting, they can also help to teach you how to read your knitting. If you have a line of offset left-leaning decreases across your chart, you will have a line of offset left-leaning decreases in your knitting as well which you can see clearly. Such things are much harder to spot and see with just written instructions, I find.
Charts are (usually) concise. That means you see what you need to do with one glance and don’t have to read multiple lines of instructions. One knit row in written form can often encompass various lines of instructions. But on a chart, it’s just one line.
I find charts much easier to read because of this and because the visual representation is easier for me to comprehend with just a glance than the written instructions. I’m very good at messing up patterns that only come with written instructions. I may have overlooked a word or two, or accidentally left out an entire line. Especially at the beginning when I haven’t memorized the pattern yet, that can be a problem.
I also find it easier to memorize a pattern with a chart (or multiple charts). I can remember images and shapes a lot better than words. And together with the muscle memory of my hands knitting the chart, I have them easily memorized. Which means I don’t need to look at the pattern that often and can relax more.
Tips for Knitting with Charts
Start Small
If you are new to charts, start practicing with simple ones. You could use the ones I’ve shown here or even choose a complete pattern. Hats are always good to practice new techniques on because their shapes tend to be simple and they aren’t that big a project. Tincanknits’ Antler Hat has a simple charted cable motif, and the pattern is free.
Or if you like knitting socks, there are many socks with great charted patterns. Cookie A usually has excellent charts, and her Monkey socks are free. Or you can try Hermione’s Everyday Socks by Erica Lueder (again, the pattern is free). Charts don’t come easier than this.
Prepare the Pattern
Keep in mind that the symbols may change from designer to designer and even pattern to pattern. Always read the pattern all the way through, and take special note of the key and glossary. Highlight important things you think you may forget. I can’t mention this often enough; it’s necessary to prepare the pattern – even the simple ones.
Make It Easy to See Where You’re At
Get yourself some highlighter tape (*) or a chart keeper (*). That makes it easier to keep your place in a chart. The highlighter tape you can tape over the row of the chart you are currently working on. And the chart keeper will have a long ruler-like magnet (or something similar) that you can place directly underneath the row you are working. That way your eyes have something to anchor to, and it’s harder to read a wrong row by accident.
If you work flat, you can add arrows (in pencil) to remind you of where to read a row from. Remember all wrong side rows (usually the even numbers), are read left to right instead of right to left. I’ve done that before on double knitting charts because I kept messing it up for some reason.
Count Rows and Repeats
And count your rows, chart repeats and always make sure you can remember later which row of a repeat you are on. I have an app for that on my Android phone, and I am sure there are more of those out there. I find them more convenient than just counting the rows and having to calculate the rest, or keeping tally sheets.
Other Chart Types
There is a different form of charts out there that isn’t as widely used, though. And I’ve never seen it in a commercial pattern instead of the traditional charts. Stitch Maps. Some people prefer this type of chart because it can give you a closer representation of the shape and motif you are knitting. Stitch Maps aren’t rectangular but follow the form described by the charted instructions.
I prefer traditional charts to Stitch Maps because I find it easier to keep track of where I am on it. My typical highlighter method doesn’t work well, because the rows may not be straight but undulating.
But if you still find traditional charts are not for you, try out Stitch Maps. Other knitters prefer them, and we all should use whatever tools work best for us.
All of the charts shown above were made by me using Stitchmastery.
Are you comfortable knitting from charts or do you struggle? Did this help you? Do you have any more questions about this? Please let me knot in the comments below.
Affiliate disclaimer: This post contains affiliate links (links marked by (*)). That means that at no extra cost to you I will receive a small compensation should you choose to purchase after clicking on such a link. Please, read this for more details.
Did you enjoy this post? Then please share it on Pinterest!